Dashboard
Im Dashboard kannst du beliebig viele Diagramme und Tabellen erstellen.
Sie helfen dir, deine Zeiten nach deinen Kriterien übersichtlich aufzubereiten.
Insbesondere das Gruppieren und Filtern nach Schlagworten und nach Zeitabschnitten helfen dir, die passenden Information zu generieren.
Dashboard öffnen
Sidebar-Ansicht
Du kannst zwischen zwei verschiedenen Orten wählen, an denen du ein Dashboard organisieren möchtest.
Beide Ansichten sind unabhängig voneinander konfigurierbar.
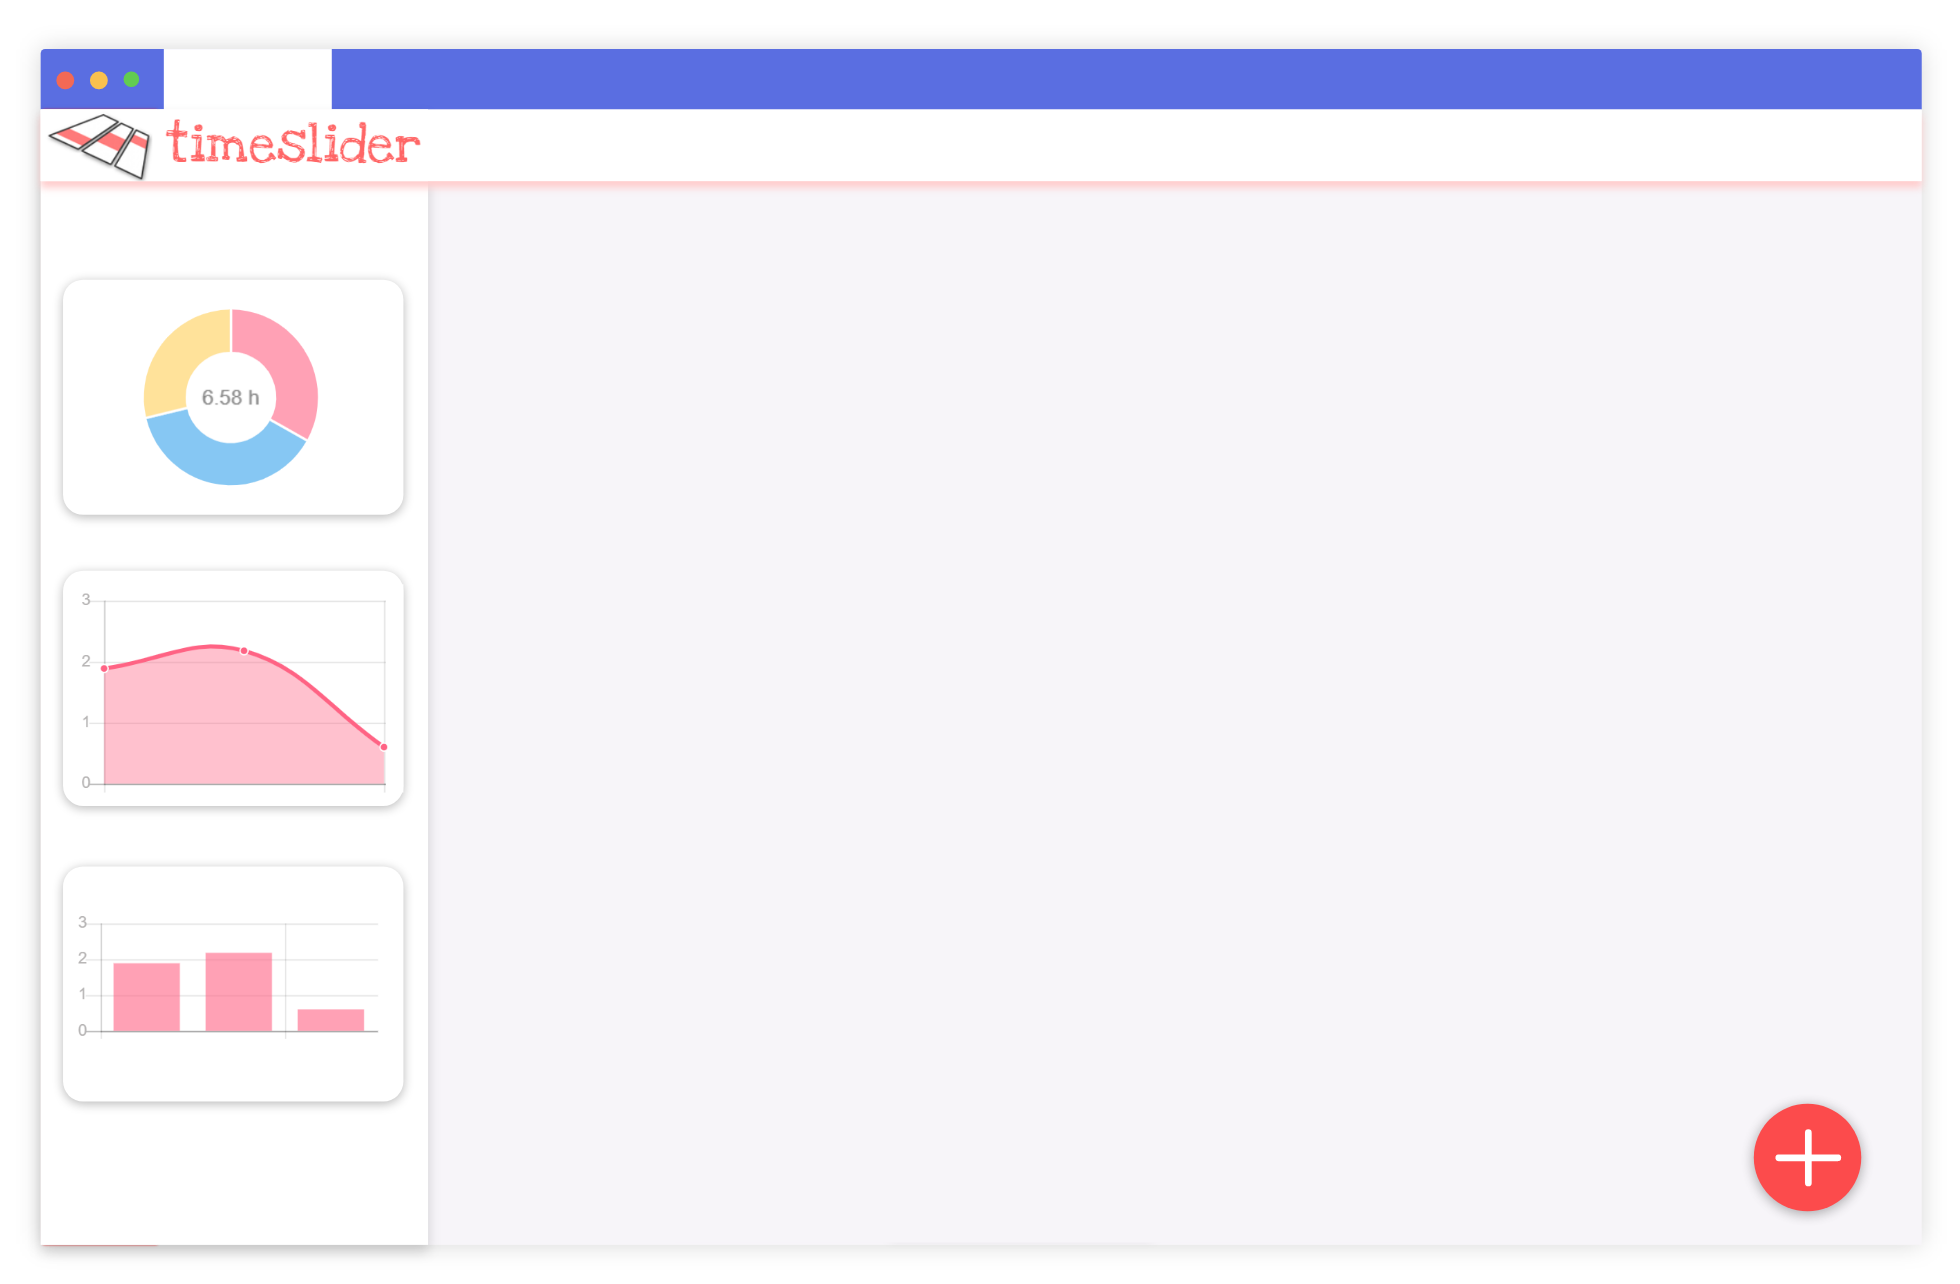
Die erste Ansicht steht dir in der Sidebar zur Verfügung.
Vollansicht
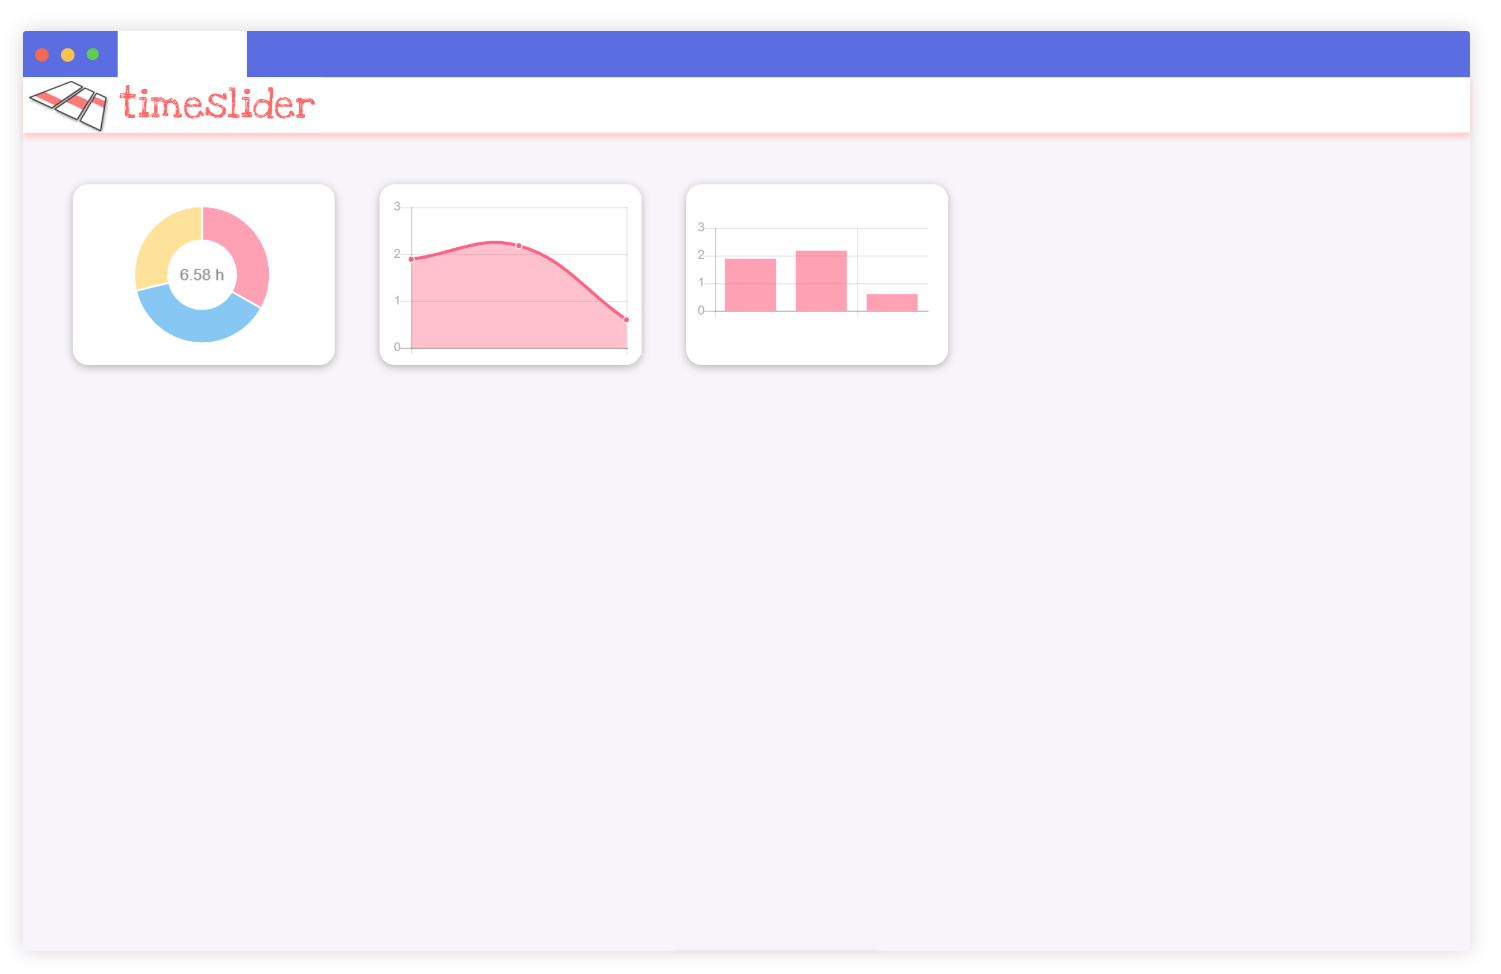
Die Vollansicht erstreckt sich über das gesamte Fenster und bietet somit wesentlich mehr Fläche für deine Diagramme.
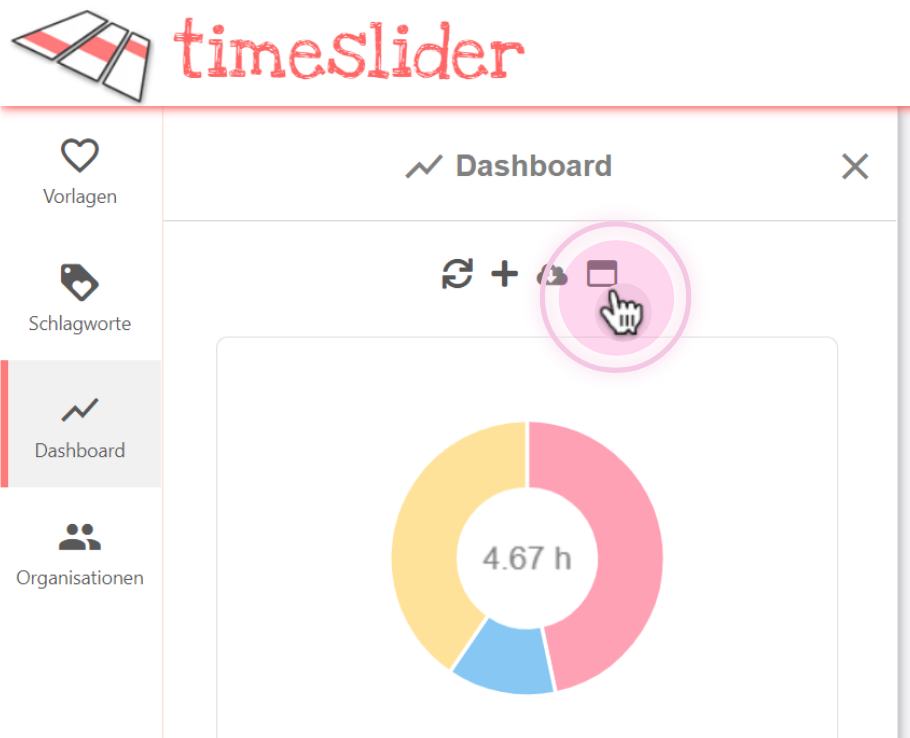
Du erreichst sie über die Schaltfläche in der Dashboard-Sidebar.
Widgets
Die folgenden Kacheltypen stehen dir zur Verfügung
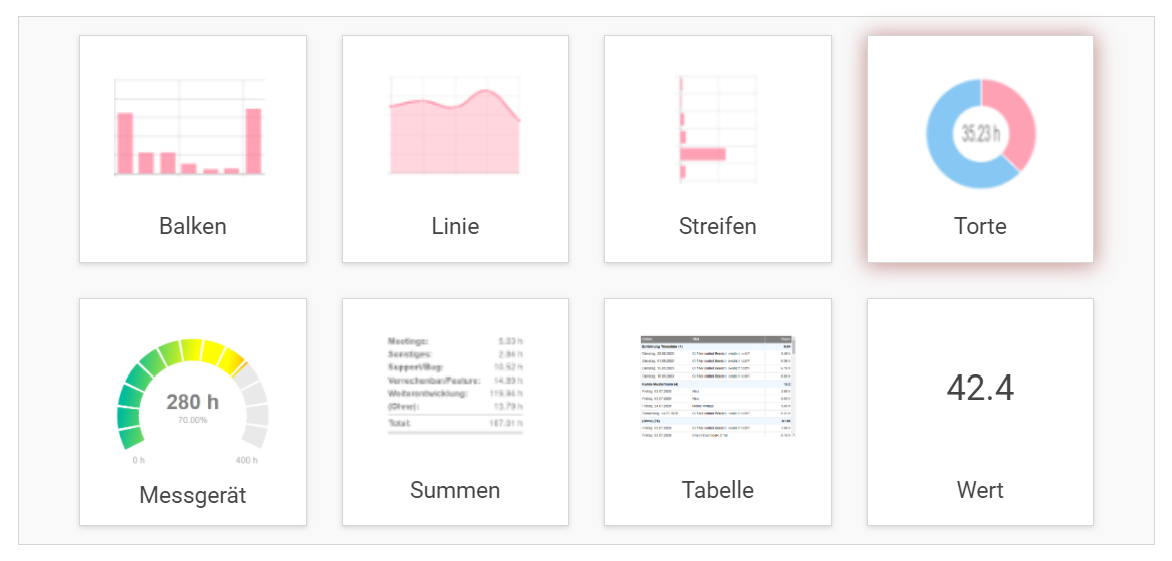
- Tortendiagramm
- Balkendiagramm (horizontal oder vertikal)
- Liniendiagramm
-
Summe (Wert)
- zeigt nur eine Zahl
- Nur Filter, keine Gruppierung möglich
- Summe (gruppiert), zeigt die Summe pro Gruppe
-
Tabelle
- ähnlich wie gruppierte Summe
- weitere Spalten möglich
- sortierbar
- Excel Export
-
Messgerät
- zeigt die Zeit in Bezug zu einem definierten Zielwert an.
- Z.B. Wie viel Budget wurde für einen Auftrag bereits verbraucht; Wurde das geplante Budget überschritten?
- Keine Gruppierung (nur Filter)
Filter
Mit einem Filter schränkst du die Timer ein, die in deinem Widget berücksichtigt werden sollen.
Am häufigsten wirst du vermutlich den Zeitfilter verwenden. Das heißt du betrachtest zum Beispiel nur Timer des aktuellen oder vergangenen Monats. Folgende vordefinierte Zeitfilter stehen zur Verfügung: Heute, Aktuelle Woche, Aktueller Monat, Aktuelles Jahr. Ein konkretes Datum als Start und Endzeitpunkt ist natürlich auch möglich.
Du kannst deine Ergebnisse aber auch auf Timer einschränken, die eine bestimmte Zeichenfolge im Titel enthalten.
Als dritte Filtermöglichkeit steht dir die Einschränkung nach bestimmten Schlagworten zur Verfügung. Dies ist unabhängig von der Gruppierung. Bedenke, dass durch die Gruppierung bereits ein Filter auf die Schlagwortgruppe existiert. Dein Filter nach Schlagworten sollte demnach eine Schnittmenge bilden. Du kannst beliebig viele Schlagwort-Filter hinzufügen und sie UND/ODER verknüpfen.

Gruppierung
Folgende Gruppierungen stehen dir zur Verfügung
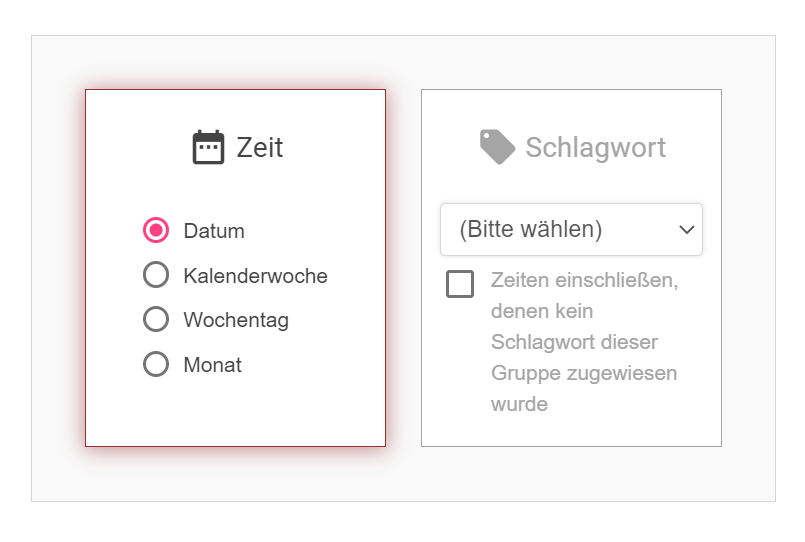
Nach Zeit
Nach Zeit
-
Datum
Z.B. Anwesenheit über den Monat - Kalenderwoche
- Wochentag
Z.B. an welchem Tag treten am häufigsten Störungsmeldungen auf? - Monat
Z.B. Welcher Monat hat die meisten verrechenbaren Stunden?
Z.B. nach Projekt, Kunde, Auftrag, …
Die Option "Zeiten ohne Schlagwort anzeigen" fügt alle existierenden Timer, denen kein Schlagwort aus der Gruppe zugewiesen wurde,
in einer zusätzlichen Gruppe hinzu.
Die Gruppierung 'Benutzer' ist nur verfügbar, wenn du für diese Kachel eine Organisation im Reiter 'Organisation' ausgewählt hast.
Organisationen
Du kannst ein Widget auf Timer einer Organisation einschränken. Diese Option ist nur verfügbar, wenn du Mitglied in einer Organisation bist und
du das Recht besitzt, Zeiten in dieser Organisation analysieren zu dürfen.
Wenn eine Organisation im Reiter ausgewählt wurde, werden nur Timer berücksichtigt, die der Organisation zugeordnet wurden. Persönliche Timer oder Timer aus einer anderen Organisation werden nicht berücksichtigt. Ist die Checkbox "Zeiten aller Mitglieder dieser Organisation einbeziehen" aktiviert, dann werden nicht nur deine eigenen Zeiten, sondern auch alle Zeiten der Organisationsmitglieder eingeschlossen. Der Haken ist nur aktivierbar, wenn man die Rolle "Analyst" oder höher besitzt.
Wenn eine Organisation im Reiter ausgewählt wurde, werden nur Timer berücksichtigt, die der Organisation zugeordnet wurden. Persönliche Timer oder Timer aus einer anderen Organisation werden nicht berücksichtigt. Ist die Checkbox "Zeiten aller Mitglieder dieser Organisation einbeziehen" aktiviert, dann werden nicht nur deine eigenen Zeiten, sondern auch alle Zeiten der Organisationsmitglieder eingeschlossen. Der Haken ist nur aktivierbar, wenn man die Rolle "Analyst" oder höher besitzt.
Einstellungen
Titel: Der Titel erscheint innerhalb des Widgets und gibt eine kurze Beschreibung des Widgets wieder.
Intervall: für automatische Aktualisierung
Anzeigewert:
Intervall: für automatische Aktualisierung
Anzeigewert:
- Anzahl
- Tage
- Stunden
- Minuten
- Prozent (Gesamt oder innerhalb der Schlagwortgruppe)
Export
Das Dashboard gibt dir die Möglichkeit alle Timer-Daten nach Excel zu exportieren. Sie können vorab durch einen Zeitfilter eingeschränkt werden.
Zudem bietet das Tabellenwidget als einziges eine Exportfunktion nach Excel oder PDF. Hier werden die Filter und Gruppierung des Widgets berücksichtig.
Zum Exportieren drücke das Download-Symbol in der Sidebar.
Zudem bietet das Tabellenwidget als einziges eine Exportfunktion nach Excel oder PDF. Hier werden die Filter und Gruppierung des Widgets berücksichtig.
Zum Exportieren drücke das Download-Symbol in der Sidebar.

